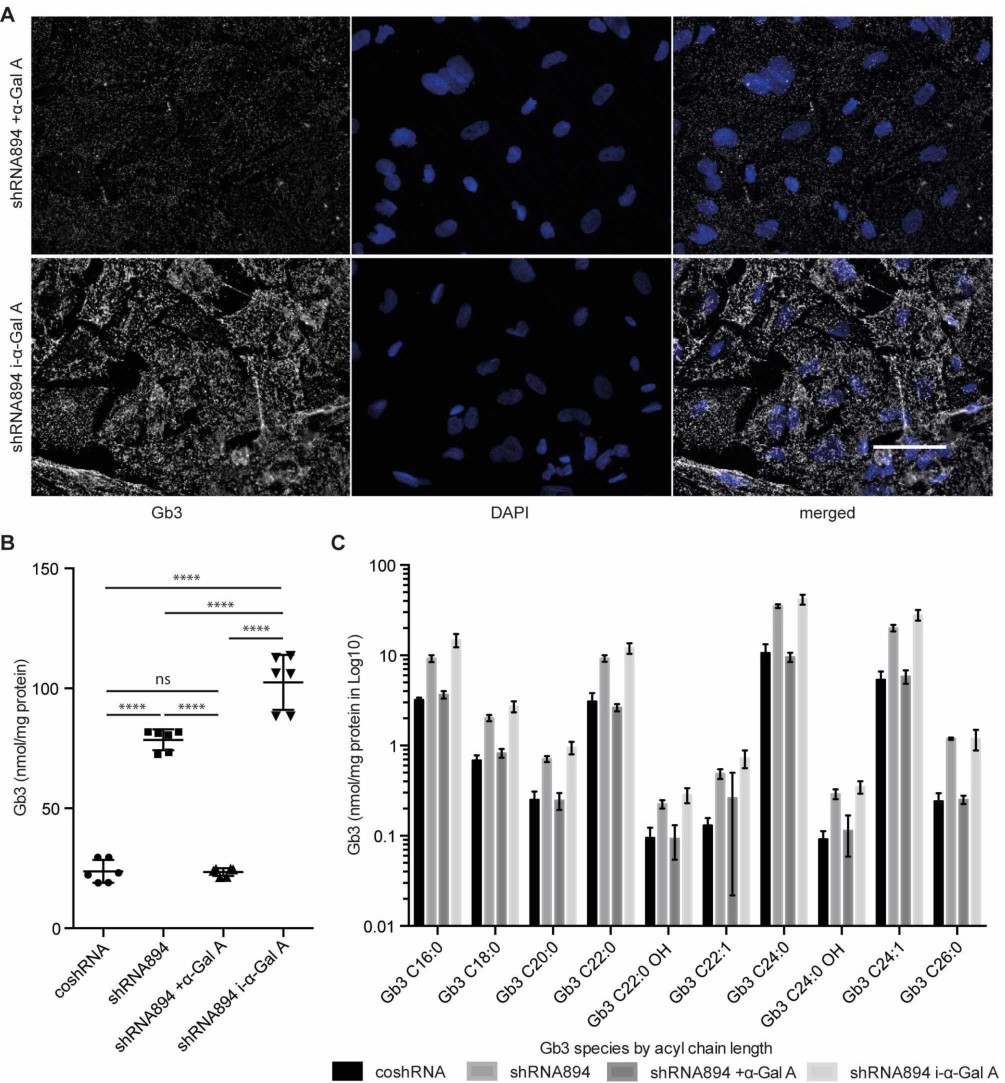
Fig. 1. Gb3 detection in α-Gal A-deficient podocytes at baseline and under ERT. (A) Immunofluorescence of Gb3 (gray), counterstained with DAPI (blue) of control (coshRNA) and α-Gal A-deficient podocytes (shRNA894) (scale bar 50 µm). (B) Quantification of total Gb3 content measured by LC-MS/MS normalized to total protein levels in control (coshRNA), α-Gal A-deficient podocytes (shRNA894) and α-Gal A-deficient podocytes treated with active (+α-Gal A) or inactivated (i-α-Gal A). Bars depict mean ± SD, **** = p<0,0001. (C) Quantification of Gb3 subspecies measured by LC-MS/MS normalized to total protein levels in control (coshRNA), α-Gal A-deficient podocytes (shRNA894) and α-Gal A-deficient podocytes treated with active (+α-Gal A) or inactivated (i-α-Gal A). Bars depict mean ± SD, significance levels not indicated.